
Why Do You Need Linux Network Monitoring Tools?
Simply put, Linux network monitoring tools allow you to see what is going on in your home network. Home networks are getting more complex. Besides just attaching a few computers and a router, many of today’s home networks are likely to have joined: a Server, a specialized media center PC, a media player, a Smart TV, a blue-ray player, a network printer, an audio-video receiver, a gaming device (or two), a Voice-Over-IP telephone system, a network switch (or two), along with WiFI and its attachments (cell phones, tablets, etc.). On their own, all of these devices generate varying degrees of traffic on the local network, and adding human intervention, a wired and/or WIFI network is doing a lot of communicating. Some of this you know about, and some you never see. These are just a few reasons to use network monitoring tools on your home network:
- See the actual traffic as it occurs, as well as taking and saving time-framed snapshots that you can review.
- Help you diagnose and isolate network problems.
- See packet transfer speeds between devices, and how much data has been transferred.
- Help you check for security vulnerabilities and hopefully make your network more difficult to hack. In many instances, you will be in effect “hacking” your own network, using some of the same tools hackers use to do the very same thing. Knowing what and where vulnerabilities exist in your network becomes the very first step in determining what to do to remove or at least reduce security issues.
- Provide a list of all active devices on the network, and a drill-down by device, showing its IP address, Mac address, open ports and their port numbers, etc.
Defining The Scope Of This Article
This topic can very quickly get incredibly complex. The output from the network monitoring tools introduced here has a great potential to be very overwhelming to all but well trained IT professionals, and sadly, seasoned hackers. That being said, it is therefore way beyond the scope of this article to drill down deep into the minutiae of each piece of software. If I did, this piece would look as if it been written by (though surely not as eloquently) Tolstoy.
I have used Adobe Photoshop both personally and professionally for at least 15 years. After all that time and experience, I still am along way from knowing everything the program is capable of doing. I learned the basics of the program, then learned to use tools and features that I needed. This article is intended to point you to a similar direction: introducing and providing the basics of each piece of software, some commonly used settings and examples, and links to additional information. By so doing, you can determine what you want to use, in both programs and their features.
Methodology
For you to get the most out of this article, it is assumed you have a running wired (ethernet) network, as well as some basic knowledge of Linux, and/or a computer with a Linux operating system installed, and some basic network knowledge. Also, be aware that the software mentioned will be run form the command-line. That being said, if you are a Linux network Noobe, you should still be OK.
On A Clear Day, You Can See….
How much data you can retrieve (see), depends on how your computer is configured, if switches on the network are used, the software you are using, and what you are trying to accomplish. By default, most Linux network monitoring tools that capture packets flowing around your network (sniffers), disregard packets that are not addressed to the very ethernet device used to capture the data. By configuring the software, or the adapter itself (via setting Promiscuous Mode from the command line: ifconfig eth0 promisc Also, you can disable Promiscuous Mode by: ifconfig eth0 -promisc), will allow you to capture packets from all “available” NIC cards. Here, as you will see in the following paragraph, the operative word is “available”.
So, what if you want to see everything? If your goal is to use a “sniffer” program to capture and analyze packets, and you are using any number of switches on your network, seeing everything becomes difficult. Basically, your sniffing gets limited to the switch where your sniffing computer is located. Getting past the switch can be done, but doing it is involved enough to be a “blog” post by itself, and probably will be more effort than most people will want to do on a home or small office network. So, what to do? In my situation, our network uses two switches. One switch, located in our living room, has all our home theater gizmo’s attached, while the other switch located in our office, has all the computers attached to it, – including my Apple PowerMac server (using Ubuntu Server software, – the creation of which will a topic for an upcoming article) that also houses all my network administration tools. Though this setup does not allow me to “sniff” the home entertainment media equipment, I don’t think I am loosing much here. On the other hand, I can see all my PCs.
“Sniffing” is one thing, and “scanning” is an entirely different matter. Should you want to know what devices are currently “up” on your network, check for open ports on your devices, and so on, scanning software can travel your entire network, – or for that matter, the Internet itself.
The Linux Network Monitoring Tools
1. IPTraf.

This program is one of my favorites, and provides a quick “who, what, when, and where” on your current network activity. There are different views. The one above is showing packets sent and received by a device’s MAC address. Here is how IPTraf is described by its developers:
“IPTraf is a console-based network statistics utility for Linux. It gathers a variety of figures such as TCP connection packet and byte counts, interface statistics and activity indicators, TCP/UDP traffic breakdowns, and LAN station packet and byte counts.
Features
- An IP traffic monitor that shows information on the IP traffic passing over your network. Includes TCP flag information, packet and byte counts, ICMP details, OSPF packet types.
- General and detailed interface statistics showing IP, TCP, UDP, ICMP, non-IP and other IP packet counts, IP checksum errors, interface activity, packet size counts.
- A TCP and UDP service monitor showing counts of incoming and outgoing packets for common TCP and UDP application ports
- A LAN statistics module that discovers active hosts and shows statistics showing the data activity on them
- TCP, UDP, and other protocol display filters, allowing you to view only traffic you’re interested in.
- Logging
- Supports Ethernet, FDDI, ISDN, SLIP, PPP, and loopback interface types.
- Utilizes the built-in raw socket interface of the Linux kernel, allowing it to be used over a wide range of supported network cards.
- Full-screen, menu-driven operation.
Protocols Recognized
- IP
- TCP
- UDP
- ICMP
- IGMP
- IGP
- IGRP
- OSPF
- ARP
- RARP
Non-IP packets will simply be indicated as “Non-IP” and, on Ethernet LAN’s, will be supplied with the appropriate Ethernet addresses.
Supported Interfaces
- Local loopback
- All Linux-supported Ethernet interfaces
- All Linux-supported FDDI interfaces
- SLIP
- Asynchronous PPP
- Synchronous PPP over ISDN
- ISDN with Raw IP encapsulation
- ISDN with Cisco HDLC encapsulation
- Parallel Line IP
The information generated by IPTraf can be valuable in making network organization decisions, troubleshooting LANs and tracking activity of various IP hosts.”
You can force “Promiscuous Mode” in the Configuration Settings.
More information about IPTraf can be found by clicking HERE.
2. Netstat

Netstat (network statistics) is a command-line tool that displays network connections (both incoming and outgoing), routing tables, and a number of network interface statistics. It is available on Unix, Unix-like, and Windows NT-based operating systems.
Traditionally, it is used more for problem determination than for performance measurement. However, the netstat command can be used to determine the amount of traffic on the network to ascertain whether performance problems are due to network congestion.
The netstat command displays information regarding traffic on the configured network interfaces, such as the following:
- The address of any protocol control blocks associated with the sockets and the state of all sockets
- The number of packets received, transmitted, and dropped in the communications subsystem
- Cumulative statistics per interface
- Routes and their status
Resources:
- For examples and detailed information about Netstat, click HERE
- Netstat manpage: http://www.faqs.org/docs/linux_network/x-087-2-iface.netstat.html
3. Tcpdump

Tcpdump is a robust packet sniffer. Wikipedia describes it:
“Tcpdump analyzes network behavior, performance and applications that generate or receive network traffic. It can also be used for analyzing the network infrastructure itself by determining whether all necessary routing is occurring properly, allowing the user to further isolate the source of a problem.
It is also possible to use tcpdump for the specific purpose of intercepting and displaying the communications of another user or computer. A user with the necessary privileges on a system acting as a router or gateway through which unencrypted traffic such as Telnet or HTTP passes can use tcpdump to view login IDs, passwords, the URLs and content of websites being viewed, or any other unencrypted information.
The user may optionally apply a BPF-based filter to limit the number of packets seen by tcpdump; this renders the output more usable on networks with a high volume of traffic.”
Resources:
- The official Tcpdump website: http://www.tcpdump.org/
- Manpage of user commands: http://www.tcpdump.org/tcpdump_man.html
- Examples from: http://openmaniak.com/tcpdump.php
4. Iftop

Simply: Iftop displays bandwidth on an NIC. From the developer’s website:
Iftop does for network usage what top(1) does for CPU usage. Iftop listens to network traffic on a named interface and displays a table of current bandwidth usage by pairs of hosts. Handy for answering the question “why is our ADSL link so slow?”.
Iftop displays on a table the current bandwidth hosts, with the pair of host using the most bandwidth at the top of the table. This makes it easier to spot the host using the most bandwidth. From the command line: iftop -p will broaden your capture to include all available interfaces.
Resources
- Developer’s website: http://www.ex-parrot.com/pdw/iftop/
- Examples: http://www.thegeekstuff.com/2008/12/iftop-guide-display-network-interface-bandwidth-usage-on-linux/
5. Nmap
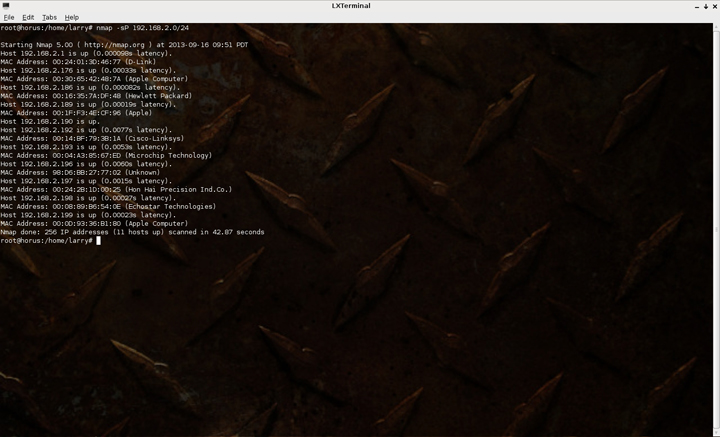
To say the nmap “is a powerful network monitoring tool”, is about like saying “a Ferrari is a nice little car”, both are major understatements. Here is the developer’s description:
“Nmap (“Network Mapper”) is an open source tool for network exploration and security auditing. It was designed to rapidly scan large networks, although it works fine against single hosts. Nmap uses raw IP packets in novel ways to determine what hosts are available on the network, what services (application name and version) those hosts are offering, what operating systems (and OS versions) they are running, what type of packet filters/firewalls are in use, and dozens of other characteristics. While Nmap is commonly used for security audits, many systems and network administrators find it useful for routine tasks such as network inventory, managing service upgrade schedules, and monitoring host or service uptime.
The output from Nmap is a list of scanned targets, with supplemental information on each depending on the options used. Key among that information is the “interesting ports table”. That table lists the port number and protocol, service name, and state. The state is either open, filtered, closed, or unfiltered. Open means that an application on the target machine is listening for connections/packets on that port. Filtered means that a firewall, filter, or other network obstacle is blocking the port so that Nmap cannot tell whether it is open or closed. Closed ports have no application listening on them, though they could open up at any time. Ports are classified as unfiltered when they are responsive to Nmap’s probes, but Nmap cannot determine whether they are open or closed. Nmap reports the state combinations open|filtered and closed|filtered when it cannot determine which of the two states describe a port. The port table may also include software version details when version detection has been requested. When an IP protocol scan is requested (-sO), Nmap provides information on supported IP protocols rather than listening ports.
In addition to the interesting ports table, Nmap can provide further information on targets, including reverse DNS names, operating system guesses, device types, and MAC addresses.”
Resources:
- Developer’s site for documentation, install info, etc: http://nmap.org/book/man.html
- Great article from Cyberciti with examples: http://www.cyberciti.biz/networking/nmap-command-examples-tutorials/
- A “beginner’s guide” from Linux.com: http://www.linux.com/learn/tutorials/290879-beginners-guide-to-nmap
6. Tshark

Tshark, like nmap, is a powerful network monitoring tool. Tshark is the command line version of Wireshark. Here is the developer’s description:
“TShark is a network protocol analyzer. It lets you capture packet data from a live network, or read packets from a previously saved capture file, either printing a decoded form of those packets to the standard output or writing the packets to a file. TShark’s native capture file format is libpcap format, which is also the format used by tcpdump and various other tools.
Without any options set, TShark will work much like tcpdump. It will use the pcap library to capture traffic from the first available network interface and displays a summary line on stdout for each received packet…….” The developer has also described Tshark in this way:
“Wireshark and TShark share a powerful filter engine that helps remove the noise from a packet trace and lets you see only the packets that interest you. If a packet meets the requirements expressed in your filter, then it is displayed in the list of packets. Display filters let you compare the fields within a protocol against a specific value, compare fields against fields, and check the existence of specified fields or protocols.
Filters are also used by other features such as statistics generation and packet list colorization (the latter is only available to Wireshark). This manual page describes their syntax. A comprehensive reference of filter fields can be found within Wireshark and in the display filter reference at http://www.wireshark.org/docs/dfref/.”
Resources:
- Developer’s description (in full), and usage: www.wireshark.org/docs/man-pages/tshark.html
- Example: www.codealias.info/technotes/the_tshark_capture_and_filter_example_page
Additional Thoughts
The six Linux network monitoring tools mentioned here should be available from any major Linux distribution, and repository. To acquire each program listed from Debian, Mint, or Ubuntu, in the terminal (become root), at the command line type, apt-get install name-of-program
There are plenty of examples for each program available, and the best way to truly use and understand each network monitoring tool is to use it.
Finally, remember that with great power comes great responsibility.